It starts with prices that actually traded.
BLOOMCAST forecasts are built in four steps, each using public data and checkable methods.
Step 1
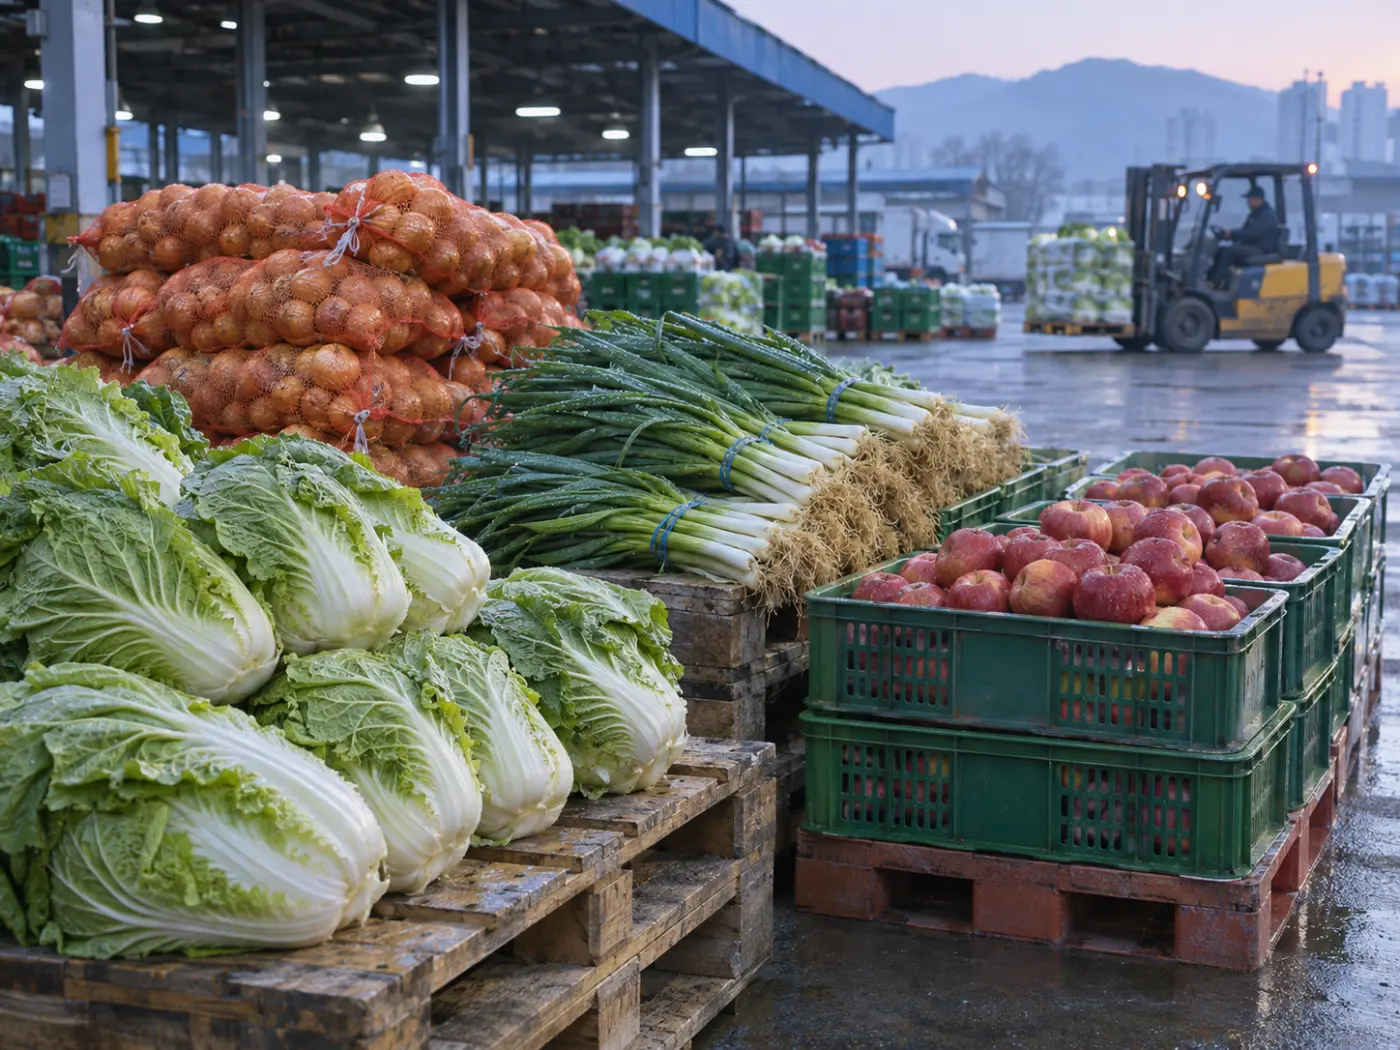
Collect real prices
The ground truth is the price that actually traded in the market.
- Korean cut flowers: aT Yangjae flower auction, daily (OpenAPI)
- Korean produce: KAMIS / aT Seoul Garak wholesale, daily
- Imported flowers: UN Comtrade import value ÷ net weight by origin, monthly
- Commodities: World Bank Pink Sheet, monthly
- Price history goes back to 2019 (start dates differ by item).
Step 2
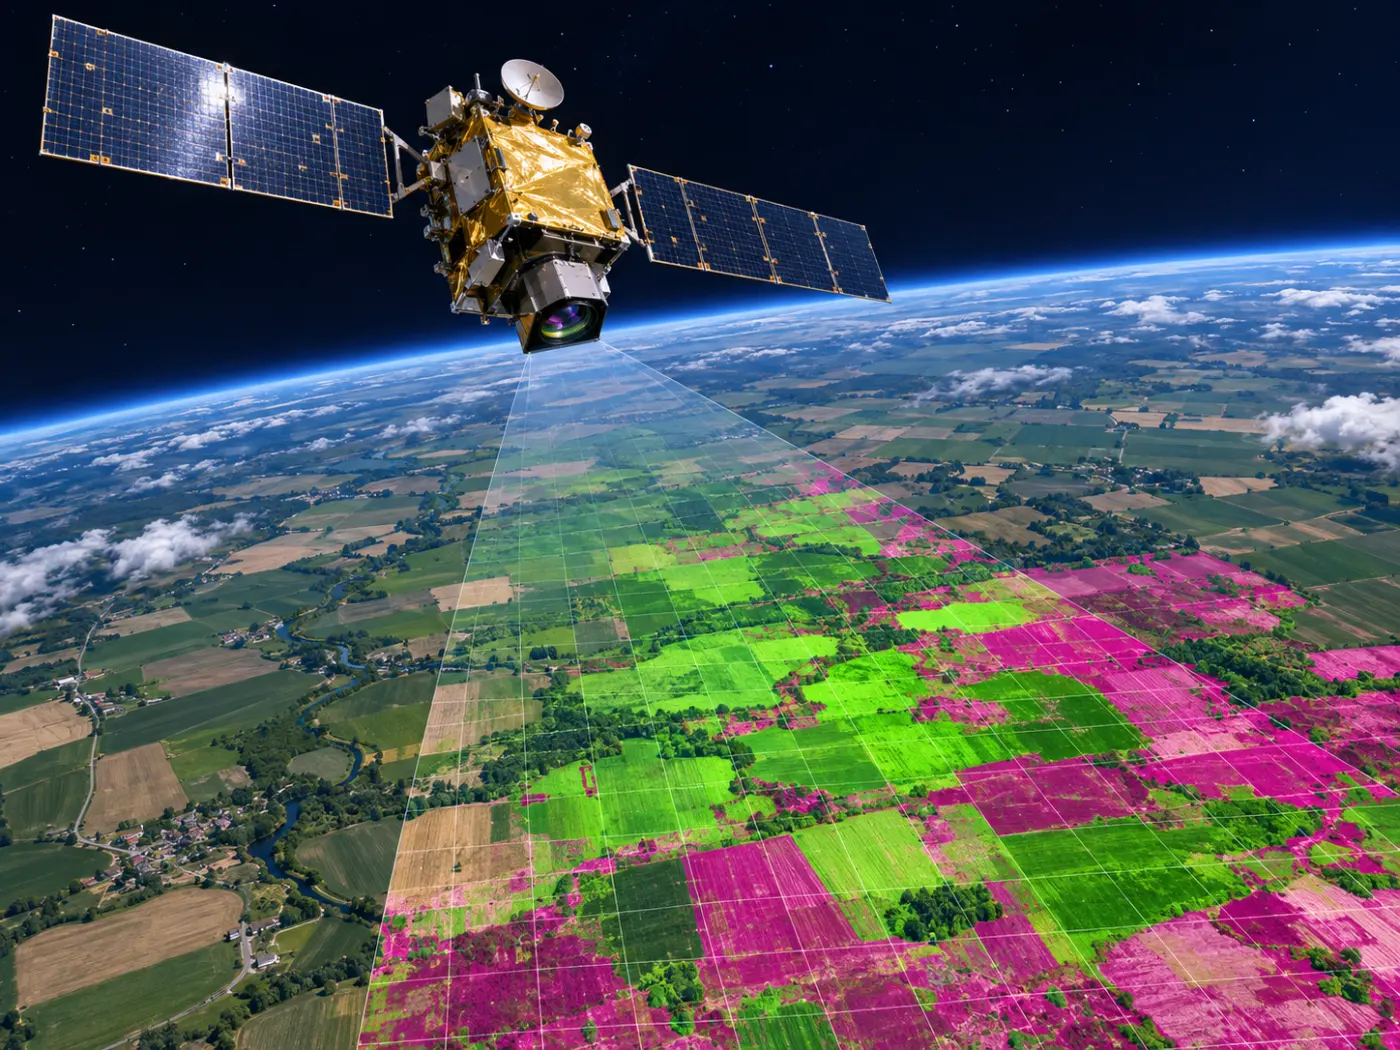
Watch growing regions from space
Fields in main growing regions are read monthly from Sentinel-2 10 m imagery to build a cropland-only supply index, plus MODIS vegetation index and ERA5 weather anomalies.
- Cropland mask: ESA WorldCover
- Vegetation: MODIS MOD13Q1, 250 m, 16-day
- Weather: ERA5 / Open-Meteo temperature, rainfall and sunlight anomalies and 16-day forecast
- Kept per item only when the backtest improves by 1% or more
Step 3
Train models and run rolling backtests
Models per horizon learn from price momentum, season, last year’s pattern, holidays and growing-region signals. At each past date they are re-run with only the data known then and scored.
Pick from several candidates
The model, a conservative method, no-change and last year are compared on the same backtest; the best is used per horizon.
Demand calendar
Events such as graduations, Parents’ Day, kimchi-making season and Christmas enter as “upcoming” and “just passed (post-event drop)”.
Range
The 80% range comes from the distribution of past errors.
Step 4
Forecast · alert · report
Median and 80% range per horizon, the drivers that moved the forecast, price alerts and CSV/PDF reports for buying meetings.
FAQ
Frequently asked questions
Which AI model do you use?
For each item and horizon we train time-series models on price momentum, season, last year, events and growing-region signals, then compare them with simple rules on the same backtest and choose. We do not insist on one model.
What if data arrives late?
The “Data status” panel on Today shows the latest date per market. Monthly statistics are published with a lag, so the latest value can be a few months old.
Can you use our own data?
On Enterprise we build a dedicated model trained on your own purchase or auction records.
Related pages
Get started
Tell us the items you trade.
We reply with a trial forecast for those items, shown next to the simple “price stays the same” baseline, so you can judge it on your own numbers.