See supply stress in the field before it shows in prices.
Crop and weather signals from growing regions and wholesale forecasts on one screen, so supply responses can start early.
Use
What supply planners watch
01
Weather anomalies
How the last 30 days of temperature, rainfall and sunlight differ from normal.
02
Crop condition
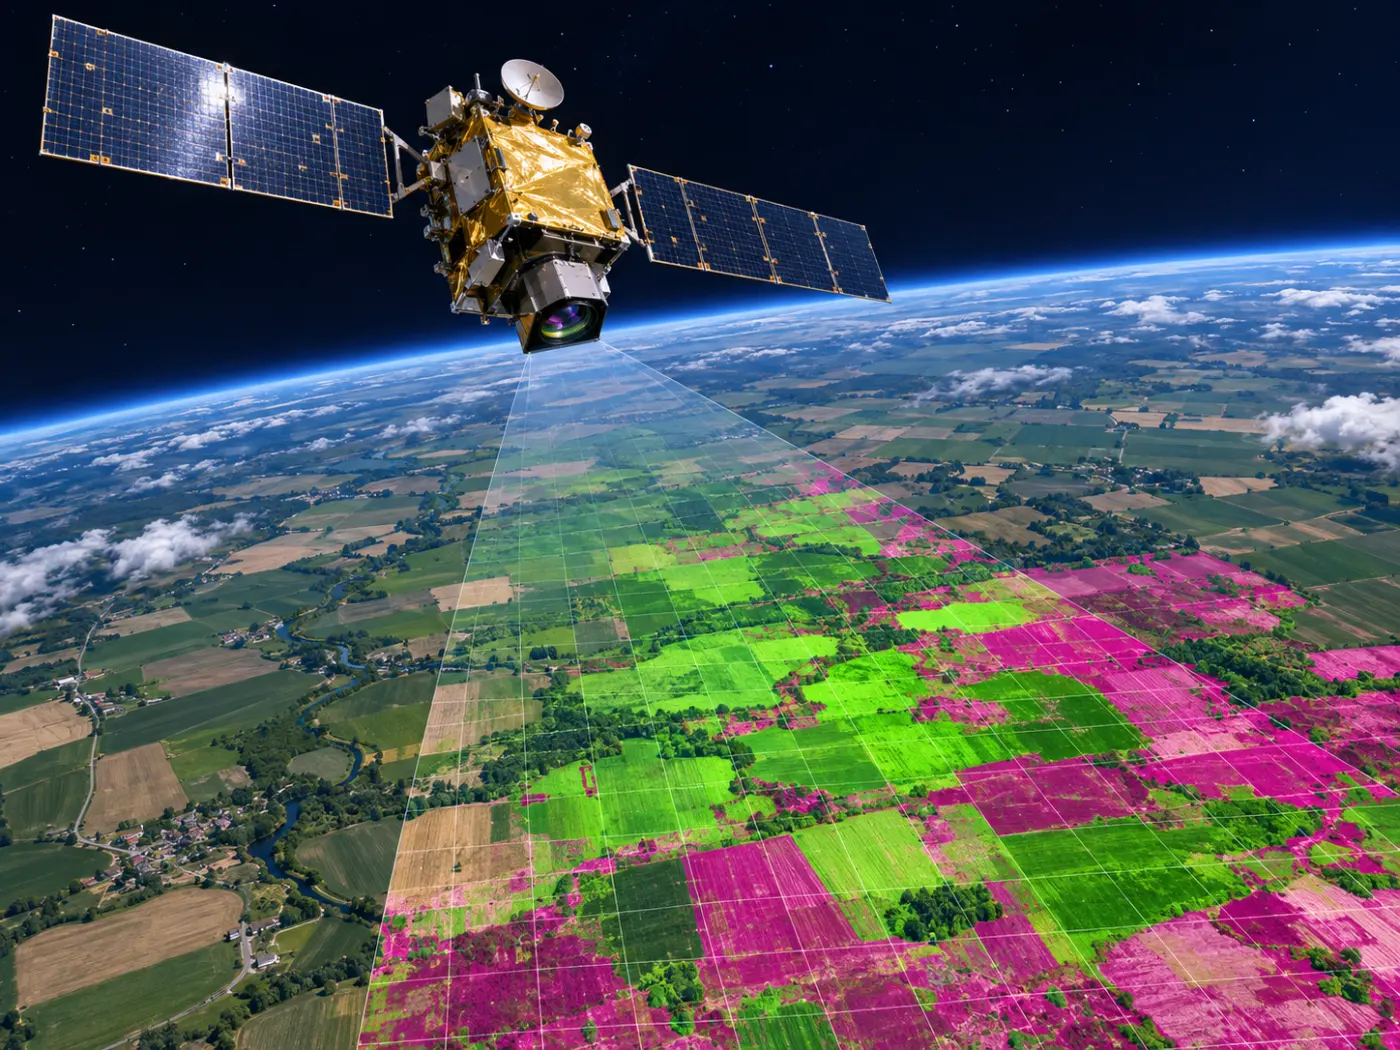
MODIS NDVI anomaly and the Sentinel-2 crop supply index.
03
Price forecasts
1-week and 1-month forecasts for the items grown there.
Limits
What we tell you plainly
- Satellite signals do not help every item (13 of 53 on the demo).
- Optical signals weaken in cloudy periods.
- Forecasts are statistical estimates; policy decisions need field checks too.
FAQ
Frequently asked questions
Can you add our own growing regions?
Custom items and regions are available on Enterprise.
Are there public-sector deployments?
Not yet that we can publish. We suggest starting with a trial forecast.
Related pages
Get started
Tell us the items you trade.
We reply with a trial forecast for those items, shown next to the simple “price stays the same” baseline, so you can judge it on your own numbers.