Price signals start in the field. We watch them from space.
From highland cabbage fields in Gangwon to flower regions in Kenya and Colombia, BLOOMCAST reads weather and crop condition in 33 growing regions every month, and uses them only when they help.
Screen
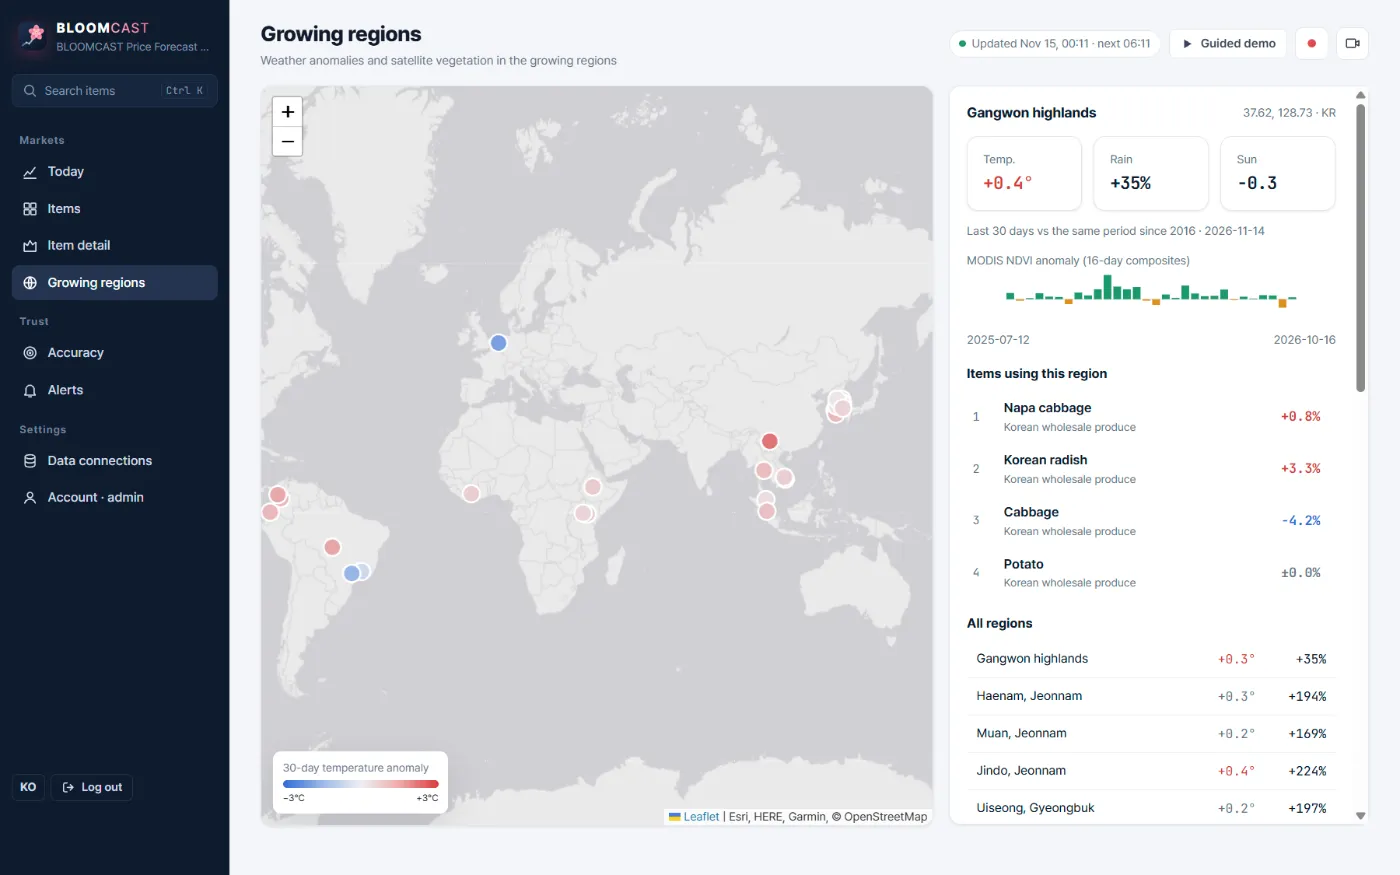
The growing regions screen
A world map colours each region by its 30-day temperature anomaly. Select one to see temperature, rainfall and sunlight anomalies, the MODIS NDVI anomaly and the items that use it.
Signals
Four growing-region signals
Sentinel-2 crop supply index
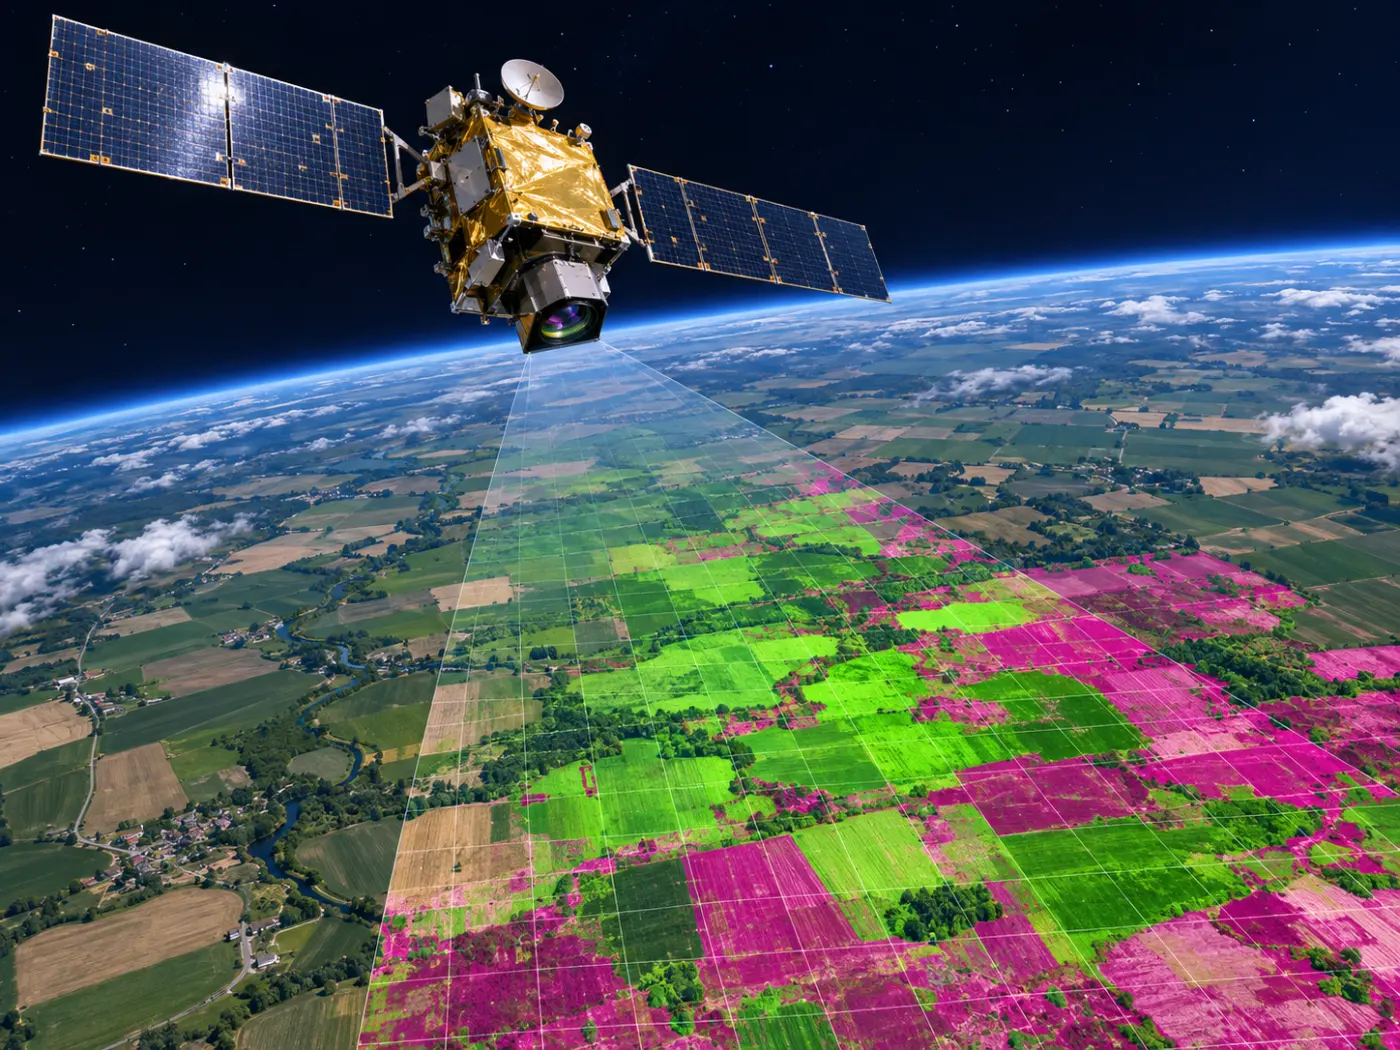
Fields in main regions are read monthly at 10 m to measure green crop area. ESA WorldCover keeps cropland only, removing forest and urban signals.
MODIS vegetation index
250 m, 16-day NDVI shows how crop condition across the region differs from normal.
Weather anomalies
ERA5 and Open-Meteo give temperature, rainfall and sunlight versus normal (same period since 2016), plus a 16-day forecast.
Exchange rates
Import prices are read with KRW, USD, EUR and JPY rates (ECB).
Principle
Used only when it helps
Adding satellite signals does not always improve a forecast. For each item we compare backtests with and without satellite and weather signals and keep them only when error falls by 1% or more.
- On the demo they helped 13 of 53 items.
- Greenhouse-grown items such as roses cannot be seen from space, so no satellite crop signal is used for them.
- For roses only temperature and sunlight were tested; the backtest was 18.05% with them vs 17.60% without, so they were left out.
FAQ
Frequently asked questions
Can satellites tell you flower prices?
Only partly. Most export flowers grow in greenhouses, so the demand calendar, price momentum and sunlight and temperature are stronger signals. Satellites are used for open-field crops.
What about clouds?
Optical satellites cannot see through clouds. The crop supply index is therefore built monthly, and weather signals such as temperature, rainfall and sunlight are tracked separately. In very cloudy months the satellite signal can be weaker.
How many growing regions?
33 on the demo. Enterprise customers can add regions.
Related pages
Get started
Tell us the items you trade.
We reply with a trial forecast for those items, shown next to the simple “price stays the same” baseline, so you can judge it on your own numbers.