Next week’s flower and vegetable prices, before the market sees them.
BLOOMCAST learns from prices that actually traded: the aT Yangjae flower auction, the Seoul Garak wholesale market and customs import unit values. It adds satellite views of growing regions, weather and the demand calendar (graduations, Parents’ Day, kimchi-making season) to forecast each item 1 week and 1 month ahead with an 80% range.
The problem
Prices move every day. Buying is still decided by gut feel.
Flower and vegetable prices can swing within a week with weather, harvests in growing regions and holiday demand. Yet the timing and size of purchases still rely on experience.
Holidays move flower prices
Auction prices rise and fall around graduations, Parents’ Day and the year end. When you buy decides your margin.
Far-away flowers, late signals
For flowers from Colombia, Kenya or the Netherlands, weather and harvest in the growing region take time to show up in prices.
Outlooks without numbers
“Prices may rise” is not enough to set contract volumes. You need how much, within what range, and how often the forecast was right.
Coverage
Starting with flowers, extending to farm produce.
BLOOMCAST forecasts 57 items in four markets. Daily items look 1 week, 2 weeks and 1 month ahead; monthly items look 1 to 3 months ahead.
Korean flower auction
Cut-flower prices at the aT Yangjae flower auction: rose, chrysanthemum, carnation, lily, gypsophila and more.
Global flower import prices
Import unit values from Colombia, Ecuador, Kenya, Ethiopia, the Netherlands and others into the Netherlands, Germany, the UK, Japan and Korea.
Korean produce wholesale
Seoul Garak market wholesale prices: napa cabbage, radish, onion, garlic, green onion, dried red pepper, apple, pear and more.
Global agricultural commodities
International benchmark prices for coffee, cocoa, tea, wheat, maize, rice, soybeans, sugar, palm oil, orange and banana.
Real screens
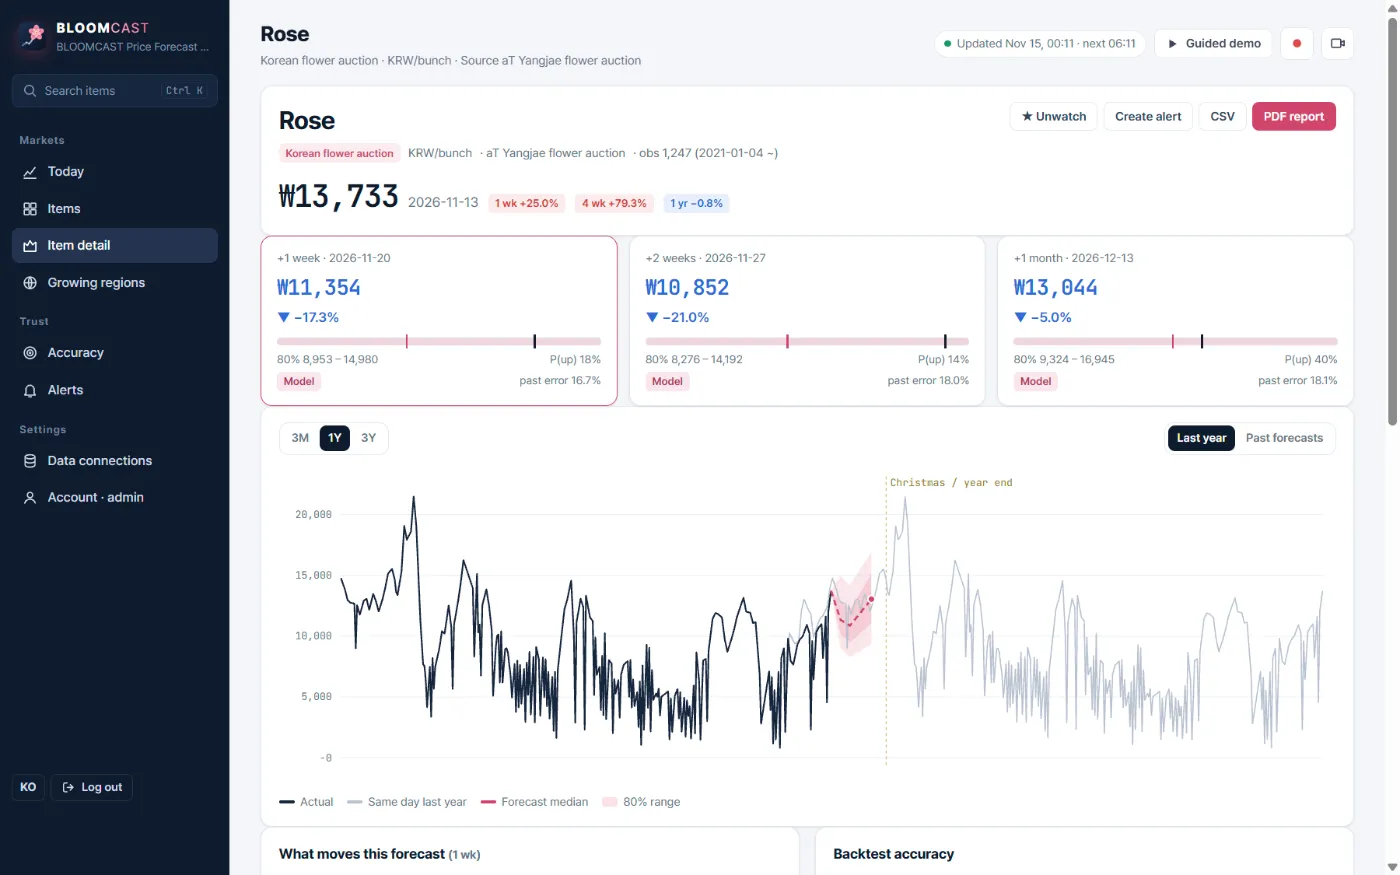
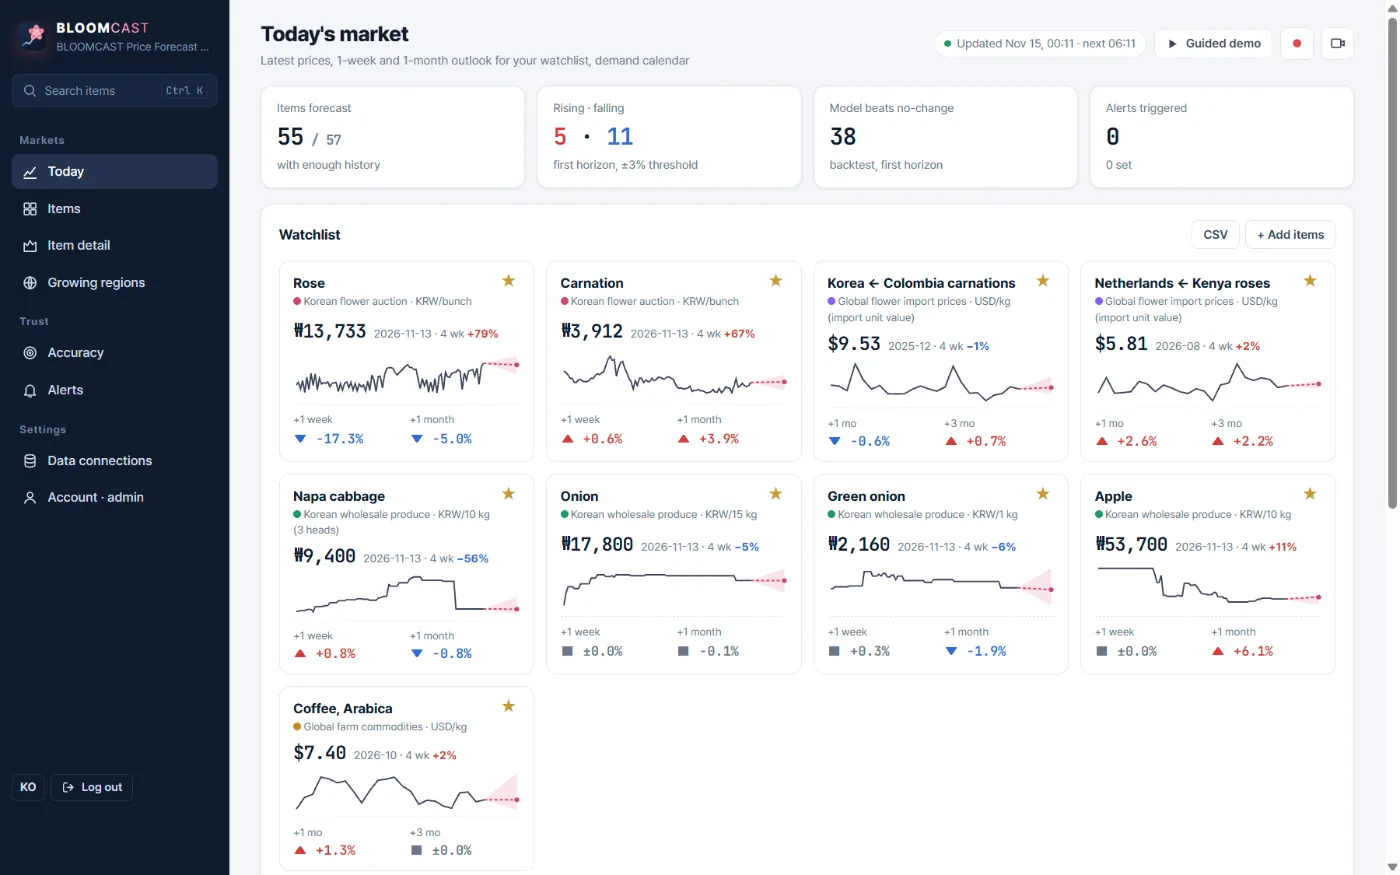
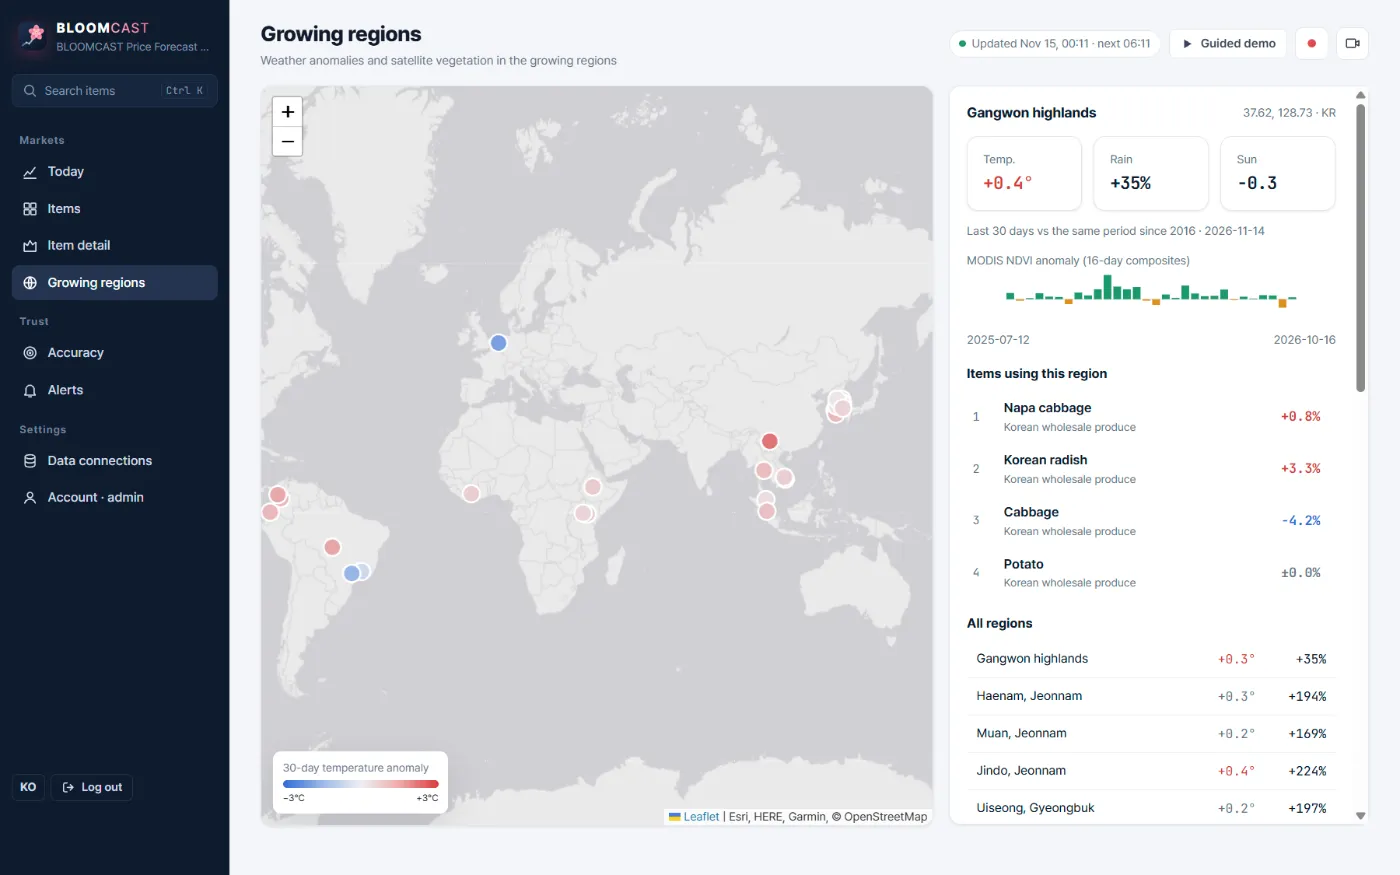
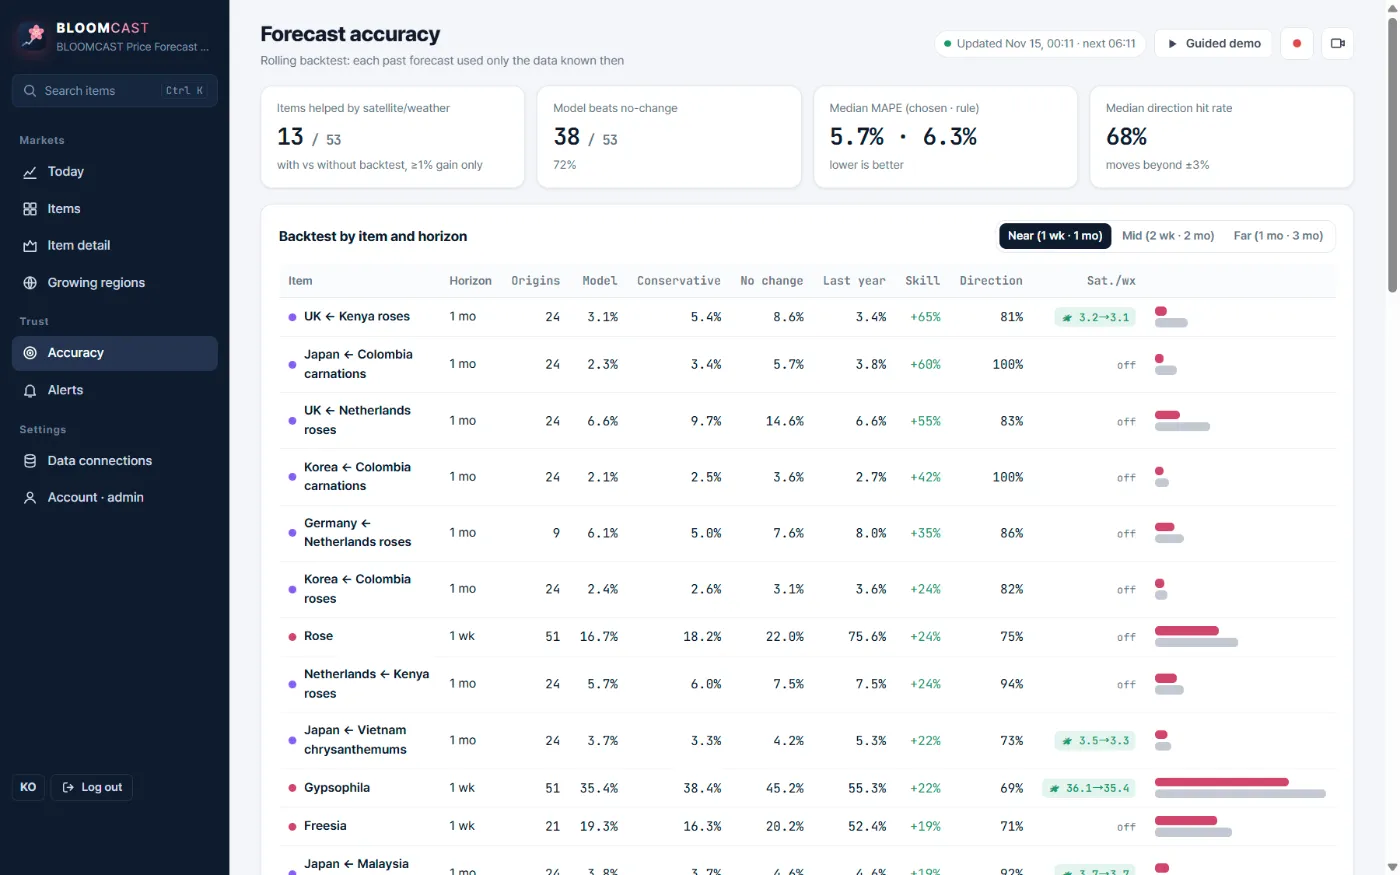
Forecast, range, reasons and accuracy on one screen.
These are real screens from the BLOOMCAST console (demo account).
Features
The numbers your buying meeting needs.
Check today’s market, read each item’s forecast and range, and weigh growing-region signals and accuracy before you decide.
Today’s market
Latest price of watched items, 1-week and 1-month forecasts, top risers and fallers, demand calendar.
Item forecasts
Median and 80% range per horizon, probability of a rise, and the drivers behind it.
Growing regions from space
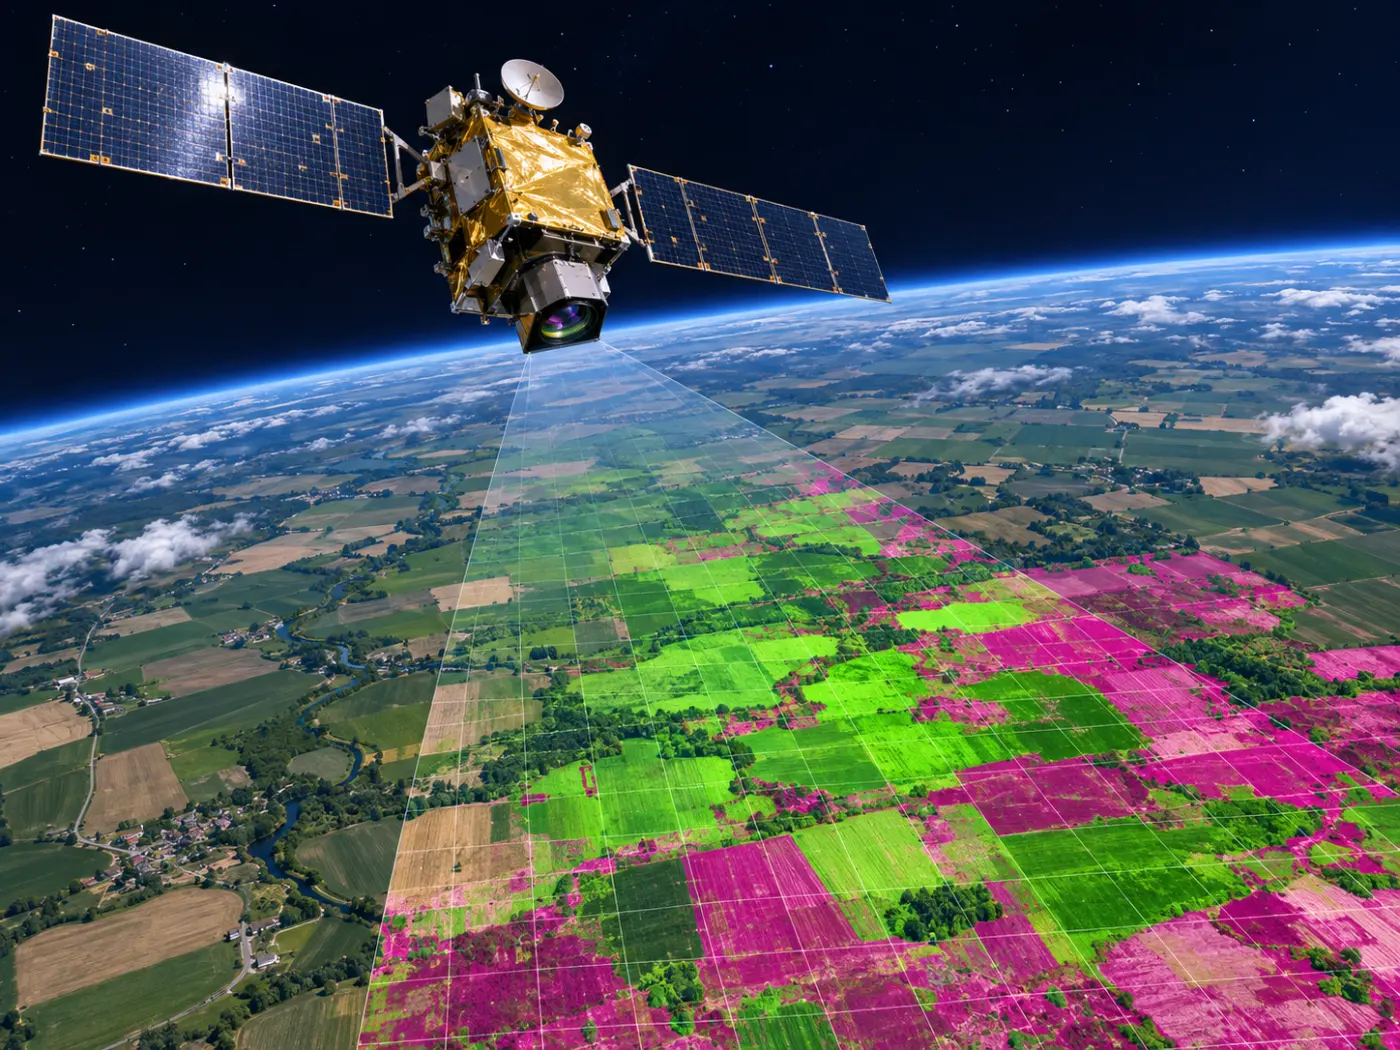
Temperature, rainfall and sunlight anomalies and vegetation index for 33 growing regions.
Published accuracy
Backtest error for every item, next to the “price stays the same” baseline.
Alerts and reports
Alerts when a price is reached, CSV and PDF reports for buying meetings.
How it works
Four steps from collecting real prices to backtesting.
How it works
The ground truth is the price that actually traded.
Collect real prices
Auction, wholesale and customs prices are pulled daily and monthly from public data and stored as training targets.
Watch growing regions
Fields in main growing regions are read monthly from Sentinel-2 10 m imagery to build a crop supply index, plus MODIS vegetation index and ERA5 weather anomalies.
Train and backtest
Models per horizon learn from price momentum, season, last year’s pattern, holidays and growing-region signals, then are re-run at past dates and scored.
Forecast, alert, report
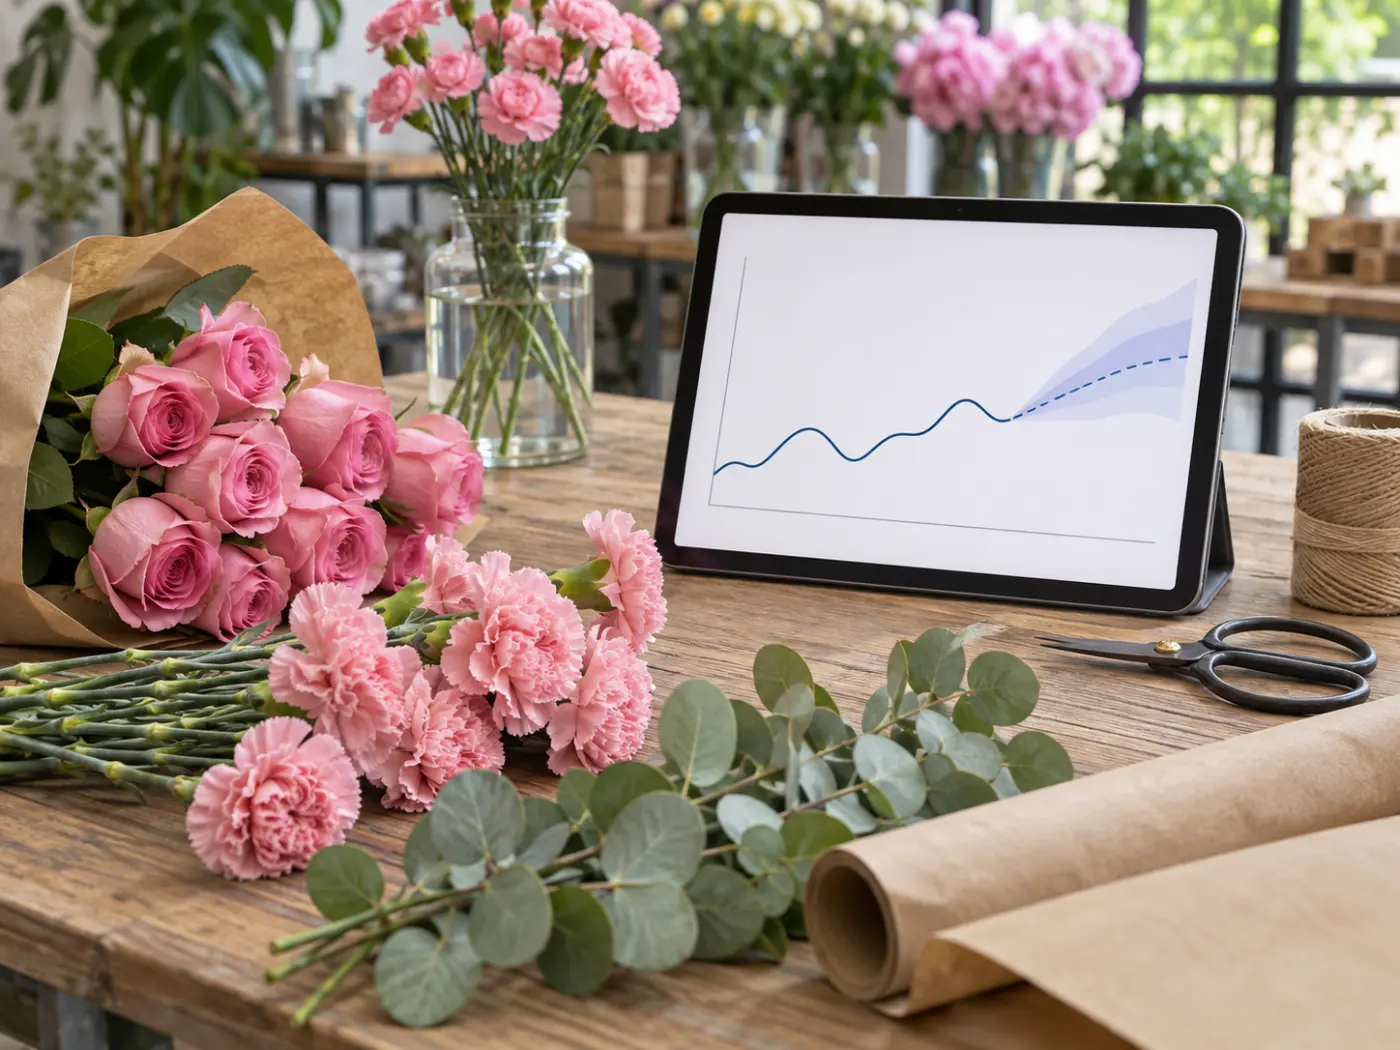
Median and 80% range per horizon, the drivers that moved the forecast, price alerts and CSV/PDF reports.
Public data with traceable sources
Accuracy principle
We show the items where the model loses, too.
Every accuracy figure comes from a rolling backtest. At each past date the model is retrained with only the data known then and compared with the price that followed. The baseline is the simplest rule: “the price stays where it is”.
38 / 53
items where the model beats the baseline (72%)
5.7% · 6.3%
median MAPE (chosen method · baseline)
68%
median direction hit rate (moves beyond ±3%)
13 / 53
items helped by satellite or weather signals
Figures from the demo screen on 15 Nov 2026, nearest horizon. They differ by item, horizon and date. Where the model does not beat the baseline, the baseline value is used. Items such as onion, where the model is no better, are shown as they are.
Who uses it
People who have to buy before prices move.
The same screens support importers and wholesalers, flower retail, food buyers and supply planners.
- Flower importers and wholesalers: order timing before Parents’ Day and graduations
- Florists and flower chains: plan stock and prices from buying prices 1 to 4 weeks out
- Food buyers and retail MDs: contract volume and timing for cabbage, onion and chili
- Co-ops and supply planners: spot supply stress early from crop and weather signals
Why BLOOMCAST
Not “prices may rise”, but a range and a report card.
Price lookup services show past prices. BLOOMCAST shows where prices are heading and how well those forecasts have done.
| Experience and gut feel | Price lookup and market notes | BLOOMCAST | |
|---|---|---|---|
| Time frame | Now | Past prices | 1 week and 1 month ahead |
| Uncertainty | None | Usually none | 80% forecast range |
| Reasons | Personal judgement | Market comments | Drivers behind each forecast |
| Growing-region signals | Rumours and news | Usually none | Satellite and weather, only when they help |
| Accuracy check | None | None | Backtest published per item |
General characteristics of each approach. Individual services differ. Full comparison
Pricing
Start with the items you trade.
Starter
- 10 watched items
- 1-week and 1-month forecasts with range
- Price alerts · CSV
Pro
- All items · all growing regions
- PDF reports · backtest detail
- 5 users · API export
Enterprise
- Model trained on your own purchase prices
- Custom items and growing regions
- Data integration · SLA
Trial forecast
- Trial forecast for the items you name
- Shown next to the baseline
- Demo console walkthrough
Prices in Korean won per month. Tax and contract terms are explained during consultation.
The company
A team that has run AI in the field.
BLOOMCAST is built by MomentCube, an industrial AI company in Incheon, Korea. We bring our experience of turning field and satellite data into decisions to price forecasting.
3 lead R&D projects
Switchgear predictive maintenance, context-aware AI safety, Safety4Cut with NVIDIA.
3 registered patents
Industrial AI safety, autonomous equipment management, automatic report generation.
Public-sector operation
AI fire watch and safety monitoring at Incheon Environmental Corporation.
Certified venture
Innovation-growth venture, in-house R&D department.
FAQ
Frequently asked questions
What is BLOOMCAST?
BLOOMCAST is a price forecasting service for flowers and farm produce built by MomentCube. It learns from real auction, wholesale and import prices, adds satellite views of growing regions, weather and the demand calendar, and forecasts each item 1 week and 1 month ahead with an 80% range.
Can satellites tell you flower prices?
Only partly, and we say so. Most export flowers grow in greenhouses, so for flowers the demand calendar, recent price movement and sunlight and temperature in the growing region are stronger signals. Satellites are used for open-field crops. For each item we compare backtests with and without the satellite signal and keep it only when error falls by 1% or more. Both numbers are shown on the item screen.
How accurate is it?
It depends on the item and horizon. The accuracy screen publishes backtest error for every item next to the “price stays the same” baseline. One-month forecasts for volatile fresh vegetables are hard; around holidays, the direction of flower prices is easier to call than the level.
Can it learn from our own purchase prices?
Yes. On the Enterprise plan we build a dedicated model that uses your own purchase or auction records as the ground truth.
Which items are covered?
57 items in four markets: Korean flower auction, global flower import prices, Korean produce wholesale and global agricultural commodities. Enterprise customers can add items and growing regions.
Is this investment advice?
No. Forecasts are statistical estimates shown with a range. Use them together with your own judgement.
Insights
BLOOMCAST blog
Why flower prices jump before graduations and Parents’ Day, read through the demand calendar
If you buy or sell flowers, half of the flower price outlook comes from the calendar. Flower auction prices swing far more…
Can satellites see vegetable prices? Uses and limits of a crop supply index
If you buy vegetables, the signal often appears in the field before it appears in the price. When weather and growth in…
How to trust a price forecast: rolling backtests and the “no change” baseline
If you plan to use a price forecast, look at its report card first. Anyone can say “cabbage prices will rise next…
Get started
Tell us the items you trade.
We reply with a trial forecast for those items, shown next to the simple “price stays the same” baseline, so you can judge it on your own numbers.