How much, within what range, and why.
Each item’s forecast is split by horizon, with the drivers that produced it and its past record on the same screen.
Screen
The item detail screen
At the top: latest price and 1-week, 4-week and 1-year change. Below: forecast cards per horizon, price chart, drivers, backtest, growing-region signals and demand events.
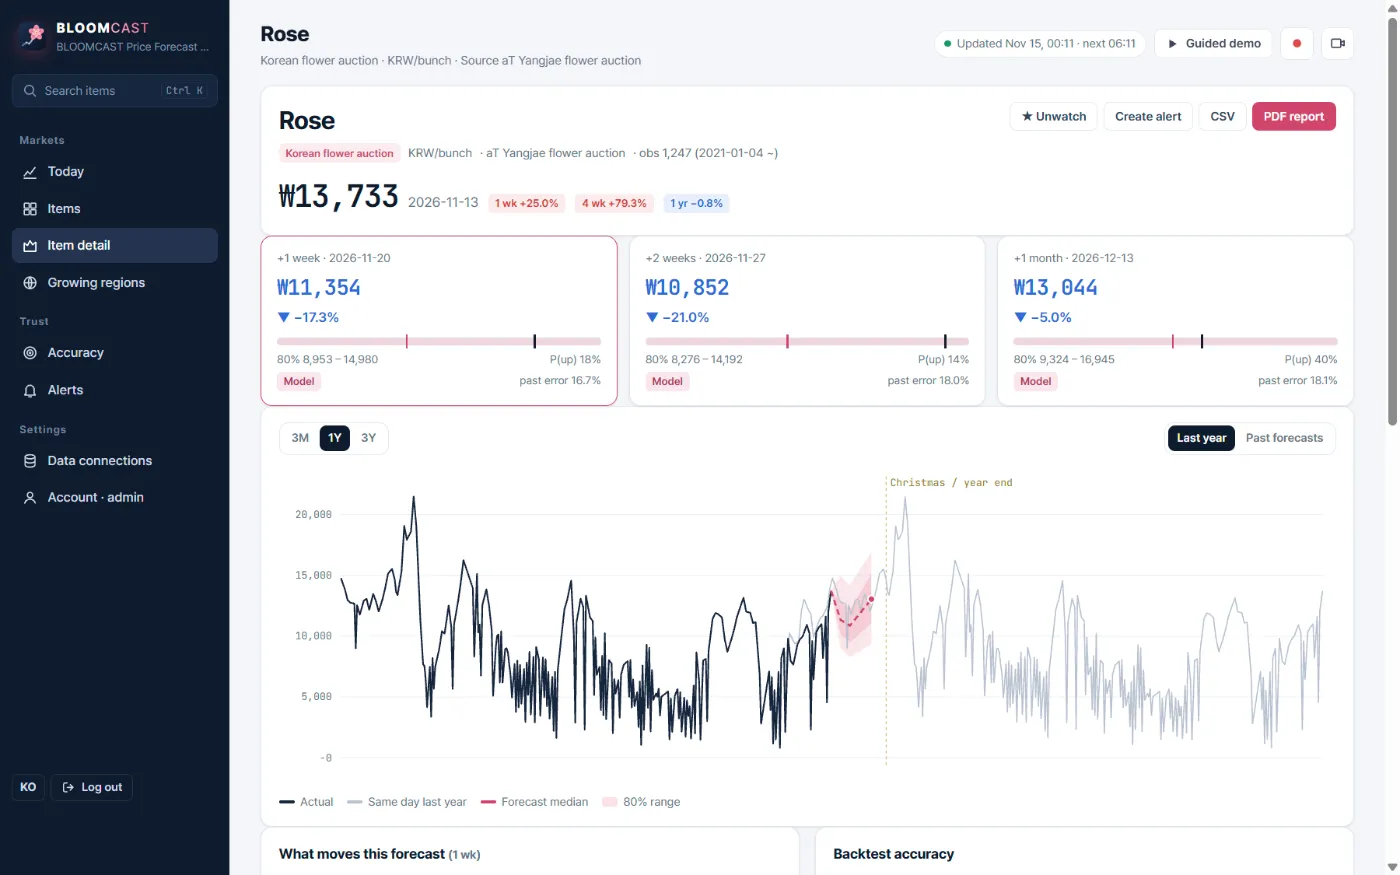
Forecast cards
Four numbers per horizon
Median forecast
The most likely price at that horizon and the change from now.
80% range
Built from the distribution of past errors, not a hand-drawn band.
Probability of a rise
The chance the price ends higher than now, for when direction is what matters.
Past error
How wrong forecasts at the same horizon were on average (MAPE).
Drivers
The drivers behind each forecast, in numbers
On the demo, the 1-week rose forecast was KRW 11,354 (−17.3%). The screen splits the reason into contributions by driver (percentage points).
| Driver | Contribution |
|---|---|
| Level vs. recent average | −14.6 pp |
| Level vs. 1-year average | −10.0 pp |
| Recent momentum (short) | −5.0 pp |
| Recent momentum (medium) | +1.3 pp |
| Seasonal pattern | +1.2 pp |
| Past demand event | −0.4 pp |
From the demo screen on 15 Nov 2026. The same screen notes: “Across 51 past forecasts at this horizon, average error was 16.7% (no change: 22.0%).”
Chart
Last year overlay and past forecasts
The 3-month, 1-year and 3-year chart overlays the actual price, the same day last year, the forecast median and the 80% range. Switch to “Past forecasts (backtest)” to see how earlier forecasts compared with what happened. Demand events such as Christmas are marked on the chart.
FAQ
Frequently asked questions
What are the horizons?
Daily items: 1 week, 2 weeks and 1 month. Monthly items (import prices, commodities): 1, 2 and 3 months.
How should I read a wide range?
It means past errors for that item and horizon were large. Then direction and the probability of a rise are more useful than the level.
Can I get a PDF?
Yes, PDF reports and CSV can be downloaded from the item screen (PDF from Pro).
Related pages
Get started
Tell us the items you trade.
We reply with a trial forecast for those items, shown next to the simple “price stays the same” baseline, so you can judge it on your own numbers.