We publish the misses, not just the hits.
At each past date we re-forecast with only the data known then and compare with the price that followed. Every item’s report card stays on screen.
Screen
The accuracy screen
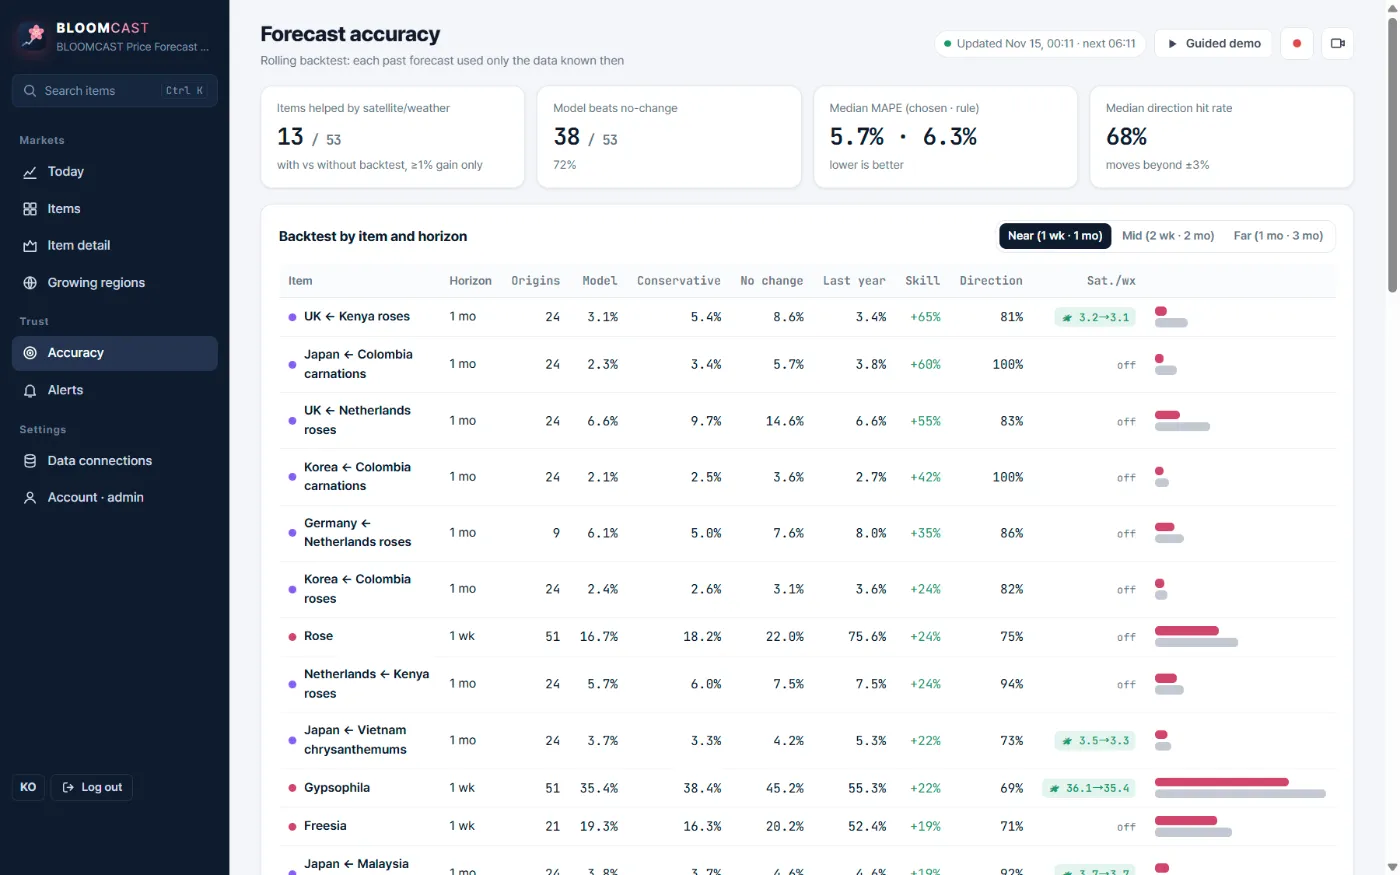
Switch between near, mid and far horizons. For each item: number of origins, model error, conservative method, no-change, last year, skill, direction and whether satellite or weather signals were used.
Summary
The report card on the demo
38 / 53
items where the model beats no-change (72%)
5.7% · 6.3%
median MAPE (chosen method · baseline)
68%
median direction hit rate (moves beyond ±3%)
13 / 53
items helped by satellite or weather
Demo screen on 15 Nov 2026, nearest horizon (1 week for daily items, 1 month for monthly items). Onion: model 3.5%, no-change 3.3%, no improvement, so the baseline value is used.
Metrics
Four metrics
Mean absolute percentage error
How far forecasts missed the actual price on average, in %. Lower is better.
1 − model MAPE ÷ no-change MAPE
How much better than the simplest rule. Rose at 1 week: +24%.
Direction hit rate
Share of moves beyond ±3% where up or down was called correctly.
80% range
Built from the distribution of past errors, not guessed.
Principle
If the model cannot beat the baseline, we use the baseline
Items and horizons where the model does not beat “price stays the same” are marked as such and the rule’s value is used. One-month forecasts for volatile fresh vegetables are hard; around holidays, flower price direction is easier than level.
| Item · horizon | Origins | Model | No change | Skill | Direction |
|---|---|---|---|---|---|
| UK ← Kenya roses · 1 mo | 24 | 3.1% | 8.6% | +65% | 81% |
| Korea ← Colombia carnations · 1 mo | 24 | 2.1% | 3.6% | +42% | 100% |
| Rose · 1 wk | 51 | 16.7% | 22.0% | +24% | 75% |
| Gypsophila · 1 wk | 51 | 35.4% | 45.2% | +22% | 69% |
| Napa cabbage · 1 wk | 51 | 10.1% | 10.2% | +5% | 67% |
| Onion · 1 wk | 51 | 3.5% | 3.3% | ±0% | 53% |
Skill can be positive while the model column is close to the baseline because skill is computed on the method chosen by backtest, which may be the “conservative” candidate. For napa cabbage the conservative method (9.7%) was chosen.
FAQ
Frequently asked questions
What is a rolling backtest?
Going back to many past dates, retraining with only the data known then, forecasting, and comparing with the price that followed. No future data leaks in.
Why compare with “price stays the same”?
It is the simplest and free forecast. A paid forecast has to beat it.
Can I see accuracy for my items?
Yes. During consultation we show a trial forecast for the items you name, next to the baseline.
Related pages
Get started
Tell us the items you trade.
We reply with a trial forecast for those items, shown next to the simple “price stays the same” baseline, so you can judge it on your own numbers.