Before the morning meeting, today’s market.
Latest prices and forecasts for your watched items, what is expected to rise and fall, and the demand events coming up, on one screen.
Screen
The Today screen
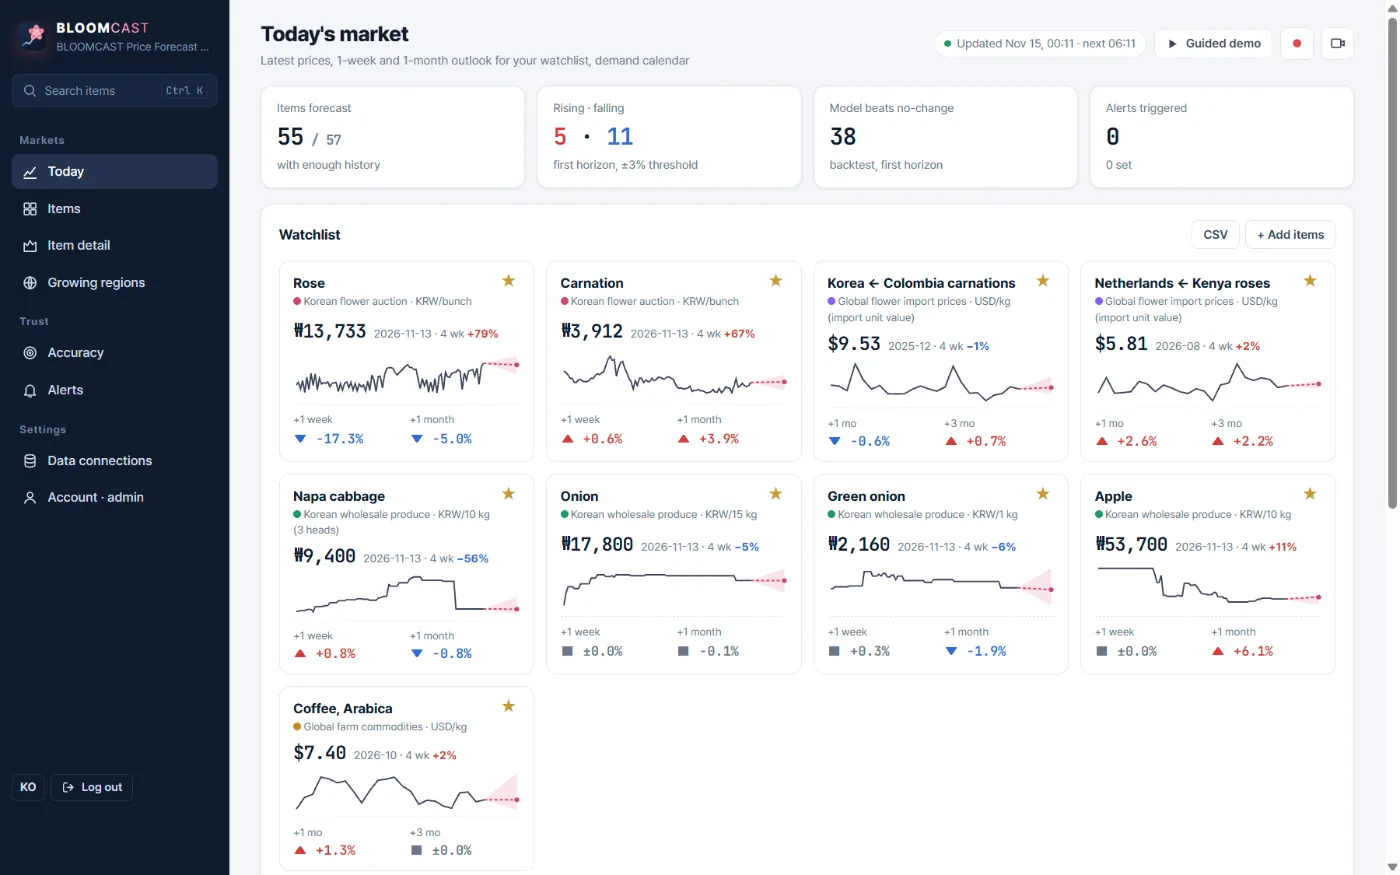
At the top: items being forecast, expected risers and fallers, items where the model beats the baseline, and alerts fired.
Layout
Four things on one screen
Watched-item cards
Latest price and date, 4-week change, recent price line and forecast change 1 week and 1 month ahead (1 and 3 months for monthly items).
Top risers and fallers
Six items expected to rise most and six expected to fall most at the nearest horizon.
Demand calendar
Events in the next 60 days, such as kimchi-making season and Christmas, with the number of items affected.
Data status
The date of the latest data for each market, so late data is visible at once.
Example
One day on the demo screen
From the demo screen on 15 Nov 2026. The numbers change daily.
| Item | Latest price | 1 week | 1 month |
|---|---|---|---|
| Rose (Yangjae auction, KRW/bunch) | KRW 13,733 (11-13) | ▼ −17.3% | ▼ −5.0% |
| Carnation (Yangjae auction, KRW/bunch) | KRW 3,912 (11-13) | ▲ +0.6% | ▲ +3.9% |
| Napa cabbage (Garak, KRW/10 kg) | KRW 9,400 (11-13) | ▲ +0.8% | ▼ −0.8% |
| Apple (Garak, KRW/10 kg) | KRW 53,700 (11-13) | ■ ±0.0% | ▲ +6.1% |
The same day the demand calendar listed kimchi-making season (20 Nov, D-5, 6 items) and Christmas and year end (24 Dec, D-39, 26 items).
FAQ
Frequently asked questions
How many items can I watch?
10 on Starter, all items on Pro.
Can I export to CSV?
Yes. The watched-item list can be downloaded as CSV.
Related pages
Get started
Tell us the items you trade.
We reply with a trial forecast for those items, shown next to the simple “price stays the same” baseline, so you can judge it on your own numbers.