Can satellites see vegetable prices? Uses and limits of a crop supply index
If you buy vegetables, the signal often appears in the field before it appears in the price.
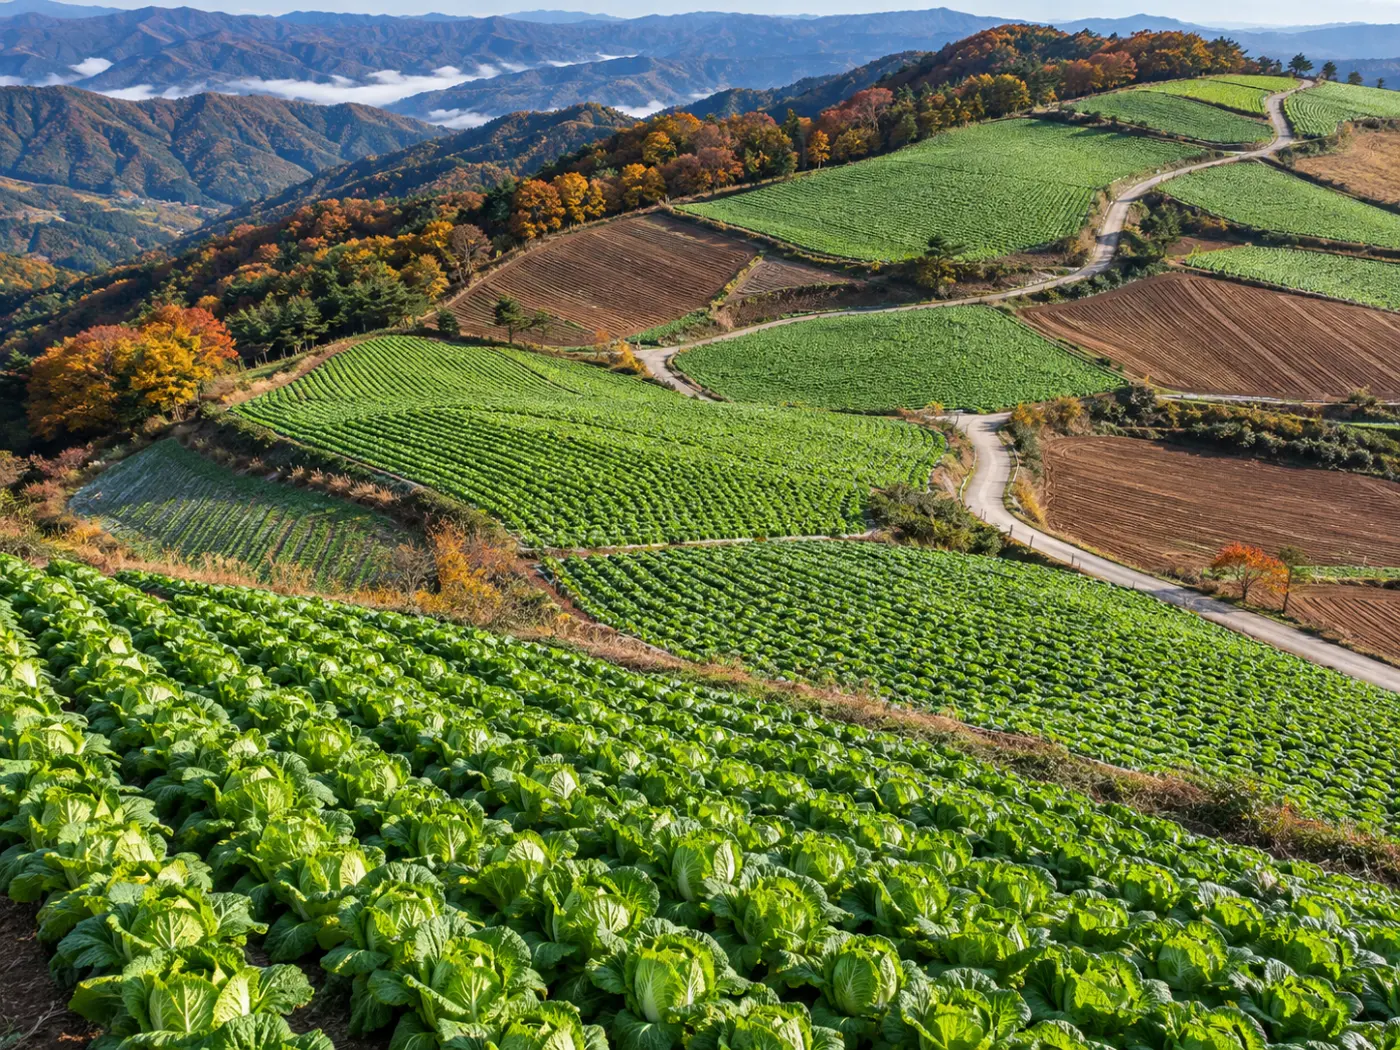
When weather and growth in the main growing regions turn bad, wholesale prices for open-field crops such as napa cabbage and radish rise a few weeks later. Seeing that signal early lets you bring a contract forward.
Satellites are almost the only way to look at large areas of farmland repeatedly on the same basis. But adding a satellite signal does not always improve a price forecast.
Below we explain how BLOOMCAST reads growing regions from satellite and weather data, and why it uses them only where they help.
Category: Forecast method
A satellite crop supply index measures green crop area in growing regions every month
The Copernicus Sentinel-2 mission images the same place about every five days at 10 m. Plants reflect near-infrared light strongly, so imagery shows how much green crop has grown.
BLOOMCAST reads fields in main growing regions monthly, measures green crop area and turns it into a crop supply index. The ESA WorldCover land-cover map keeps cropland only, so forests and urban green are not mixed in.
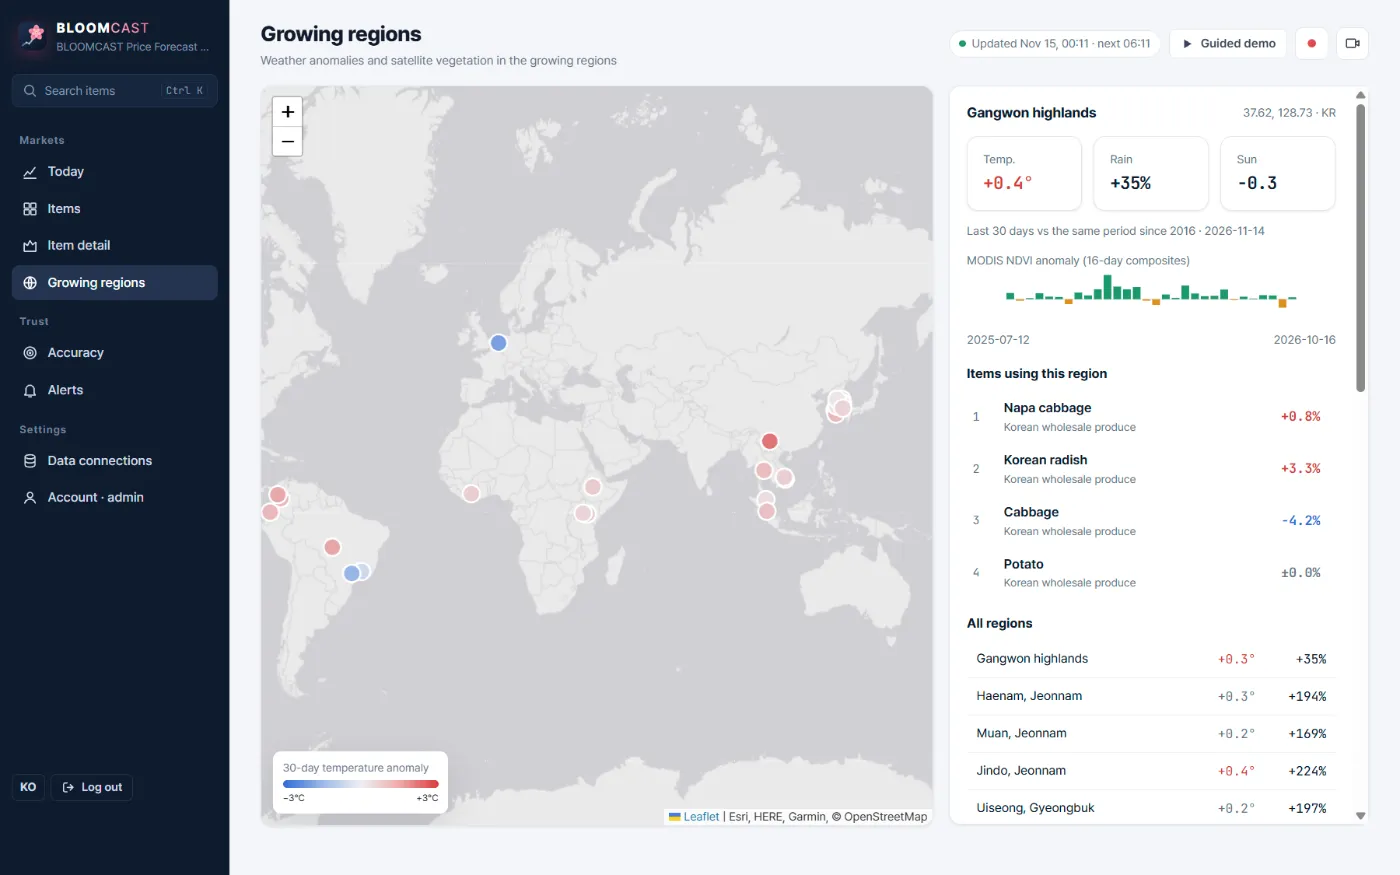
On top of that come NASA MODIS 250 m vegetation index (NDVI) anomalies, and ERA5 / Open-Meteo temperature, rainfall and sunlight anomalies with a 16-day forecast.
How a growing-region signal is built
WorldCover keeps only farmland in the region.
Sentinel-2 10 m imagery measures crop area monthly.
MODIS NDVI and ERA5 weather versus normal.
Used only if the price backtest improves by 1% or more.
Satellite signals are used for open-field crops, not greenhouse flowers
Most export roses and carnations grow in greenhouses. A satellite sees the roof, not the crop inside.
For flowers, the demand calendar, recent price movement and sunlight and temperature at origin are stronger signals. On the demo, roses used no satellite crop signal; temperature and sunlight were tested and the backtest was 18.05% with them and 17.60% without, so they were left out.
Optical satellites cannot see through clouds either. In cloudy months the satellite signal can weaken, which is why weather signals are tracked separately.
Using satellites only when they help is the rule
For each item BLOOMCAST compares backtests with and without satellite and weather signals and keeps them only when error falls by 1% or more. Both numbers appear on the item and accuracy screens.
On the demo the signals helped 13 of 53 items. For example, the 1-week green onion error fell from 5.1% to 5.0% and chrysanthemum from 14.5% to 14.3%.
Many gains are small. Still, showing which items gained and by how much is more useful for real buying decisions than simply saying “we use satellites”.
That covers how satellites read growing regions and their limits; the screen is described on the growing regions from space page.
Frequently asked questions
Do satellite images cost money?
Sentinel-2, MODIS and ERA5 are public data, so adding regions hardly adds data cost.
Can you watch our own fields?
Custom growing regions can be discussed on Enterprise.
Does the satellite confirm the harvest?
No. It is an early signal of change over wide areas. Use it with field checks.
Tell us the items you trade
We reply with a trial forecast for those items, next to the no-change baseline, so you can judge it on your own numbers.
Request a demo →Edited and answered by the MomentCube BLOOMCAST team / james@momentcube.com · +82-32-212-1011