How to trust a price forecast: rolling backtests and the “no change” baseline
If you plan to use a price forecast, look at its report card first.
Anyone can say “cabbage prices will rise next month”. What matters is how often such forecasts were right in the past.
Many outlooks come without a report card. Hits are remembered and misses forgotten, which makes them hard to use for decisions with real money at stake.
Below we explain the rolling backtest BLOOMCAST uses to measure accuracy, and why “price stays the same” is the baseline.
Category: Forecast method
A rolling backtest goes back in time and forecasts again
A rolling backtest returns to many past dates, retrains the model with only the data known at each date, forecasts, and compares with the price that followed.
The key is using only what was known then. If later data leaks in, accuracy looks better than it really is.
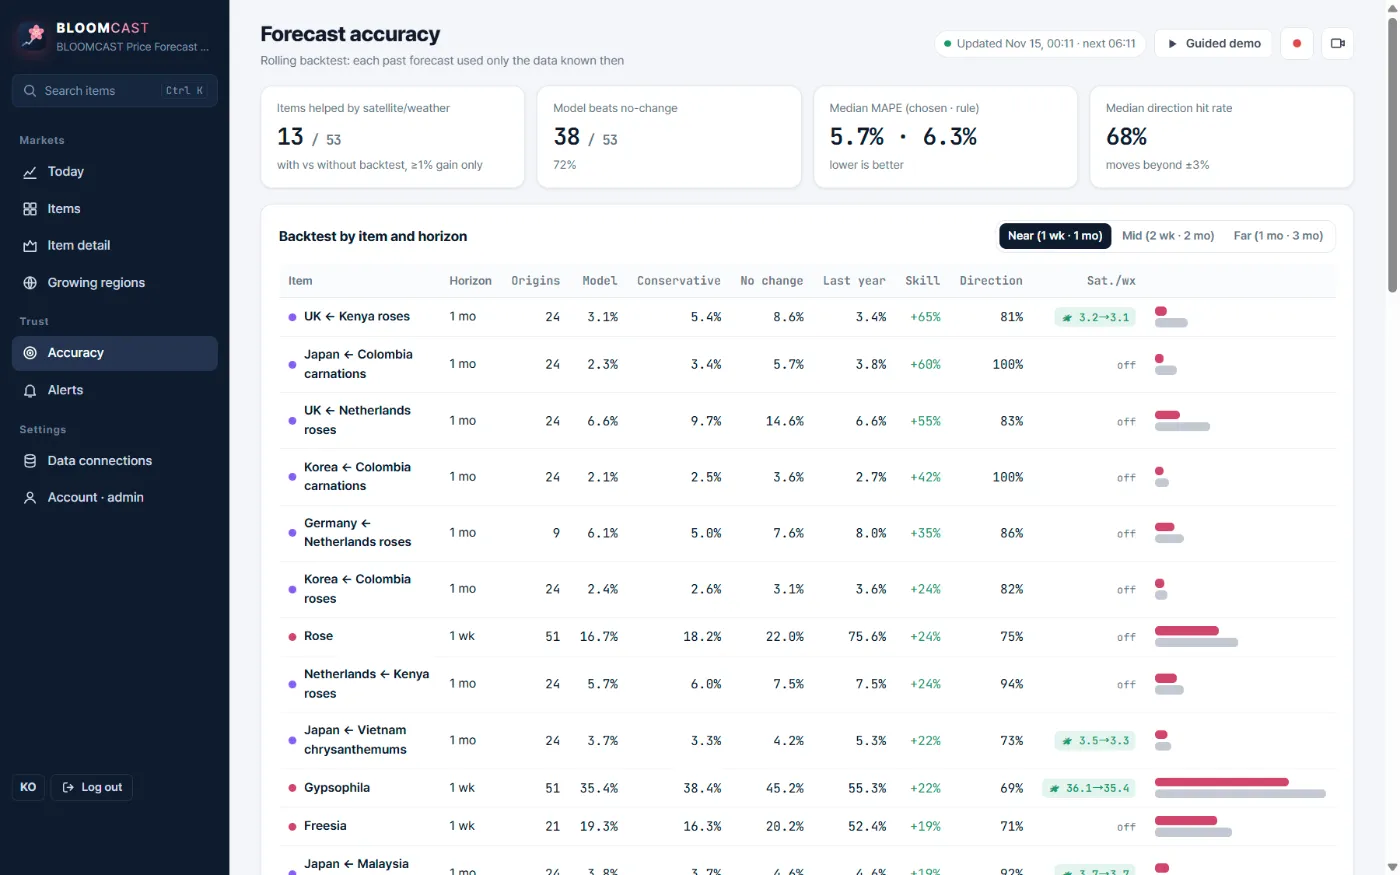
On the BLOOMCAST demo, daily items were re-forecast weekly over the last 12 months and monthly items at 24 dates. The 1-week rose forecast had 51 origins.
Four steps of a rolling backtest
Choose many past dates as forecast origins.
Keep only data known up to each date.
The model and simple rules each forecast.
Compare with the price that followed.
A forecast has to beat “price stays the same”
The simplest forecast is that the price will stay where it is. It is free and anyone can use it. A paid forecast should at least beat it.
For each item and horizon BLOOMCAST shows the model’s mean absolute percentage error (MAPE) next to no-change, last year and a conservative method, along with skill (1 − model MAPE ÷ no-change MAPE) and the direction hit rate for moves beyond ±3%.
On the demo the model beat the baseline for 38 of 53 items (72%); median MAPE was 5.7% for the chosen method and 6.3% for the baseline. UK ← Kenya roses at 1 month scored 3.1% vs 8.6%, a skill of +65%.
Publishing the losing items is where trust starts
The model does not win everywhere. On the demo, onion at 1 week scored 3.5% vs 3.3% for no-change, no improvement, and Netherlands ← Ethiopia roses at 1 month showed none either.
BLOOMCAST marks such items and horizons instead of hiding them and uses the baseline value as the forecast. It also states plainly that 1-month forecasts for volatile fresh vegetables are hard.
When choosing a forecast, ask first not “how accurate is it?” but “does it show where it is right and where it is wrong?”
That covers rolling backtests and the no-change baseline; the full report card is on the published accuracy page.
Frequently asked questions
Is a lower MAPE always better?
Items differ in how much they move, so MAPE alone is hard to compare across items. Look at skill against the baseline for the same item.
Will backtest results hold in future?
No. Past performance does not guarantee future results, which is why they are recalculated as new data arrives.
Can we see a report card for our items?
During consultation we show a trial forecast for the items you name, next to the baseline.
Tell us the items you trade
We reply with a trial forecast for those items, next to the no-change baseline, so you can judge it on your own numbers.
Request a demo →Edited and answered by the MomentCube BLOOMCAST team / james@momentcube.com · +82-32-212-1011